

WNBA Visualized
Recapping 2025 in Seven Charts

While most teams have one game left to play, and there is some seed jockeying left to be sorted out, the eight spots in the 2025 WNBA playoffs have been filled. Before we dive into what is sure to be an exciting, extended playoffs, let’s look back on the main storylines from the season that was with, of course, some charts.
Injury Woes
At the beginning of the season, I posted a visual guide to each team’s projected starting lineups. Those lineups changed a lot over the course of the season, partly due to EuroBasket stealing away international players for a stretch, but mostly due to injuries.
The New York Liberty, for instance, featured 18 unique five-player starting combos. Their opening night starting unit has only played 11 games together as Natasha Cloud (3 games missed), Sabrina Ionescu (6), Breanna Stewart (13), and Jonquel Jones (13) have all missed significant time. Overall, Liberty players have sat out over 130 games combined this season due to injury.
The Storm have missed a similar number of “player-games”, mostly due to season-ending injuries to three players (Nika Muhl, Jordan Horston, and Katie Lou Samuelson) before the season even started. The Fever, meanwhile, lost their entire backcourt, including Caitlin Clark, as the season went on.
According to the IX Injury Tracker, helpfully organized and maintained by Lucas Seehafer, nearly 1,000 player-games have been lost to injury this season.
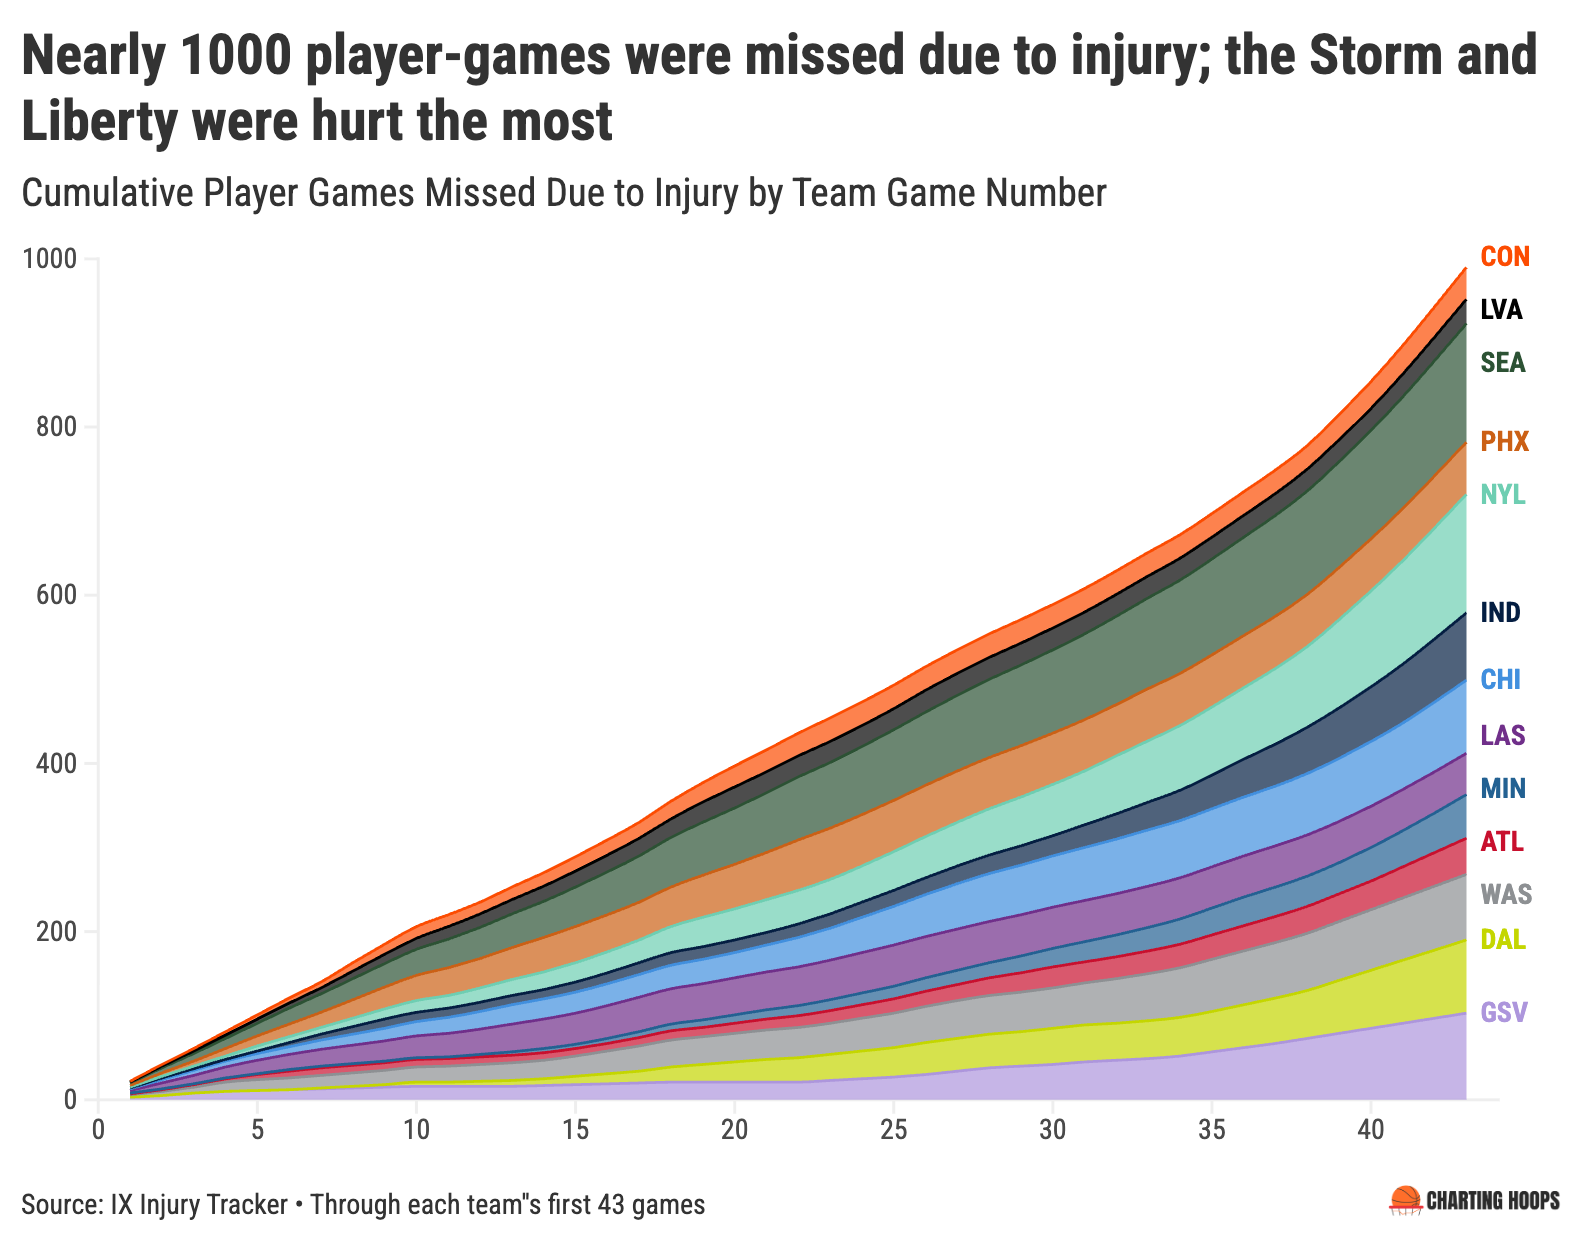
The Aces have been the healthiest team: A’ja was out four games for concussion protocol and a bum wrist, and back-up center Megan Gustafson missed 18 with an ankle but otherwise the team’s been healthy, helping power their second half surge. The Connecticut Sun have also been relatively healthy, but that has not powered a surge of any kind.
A Head-Scratching Schedule
Injuries are (famously) hard to predict, but there are a number of culprits we can point to for robbing us of these players, most notably, the schedule. The WNBA increased the number of games each team played this season to 44, up from 40 last season and 34 before that. More games = more TV ad spots = more money, important for paying players what they’re owed. The problem, as Seehafer points out, is that the league is cramming more games into essentially the same window of time, resulting in fewer days between games. Ideally, players would get three-to-four days off to rest and recover their bodies; instead they’re getting two-to-three.
Rebecca Lobo brought this up early in the season:
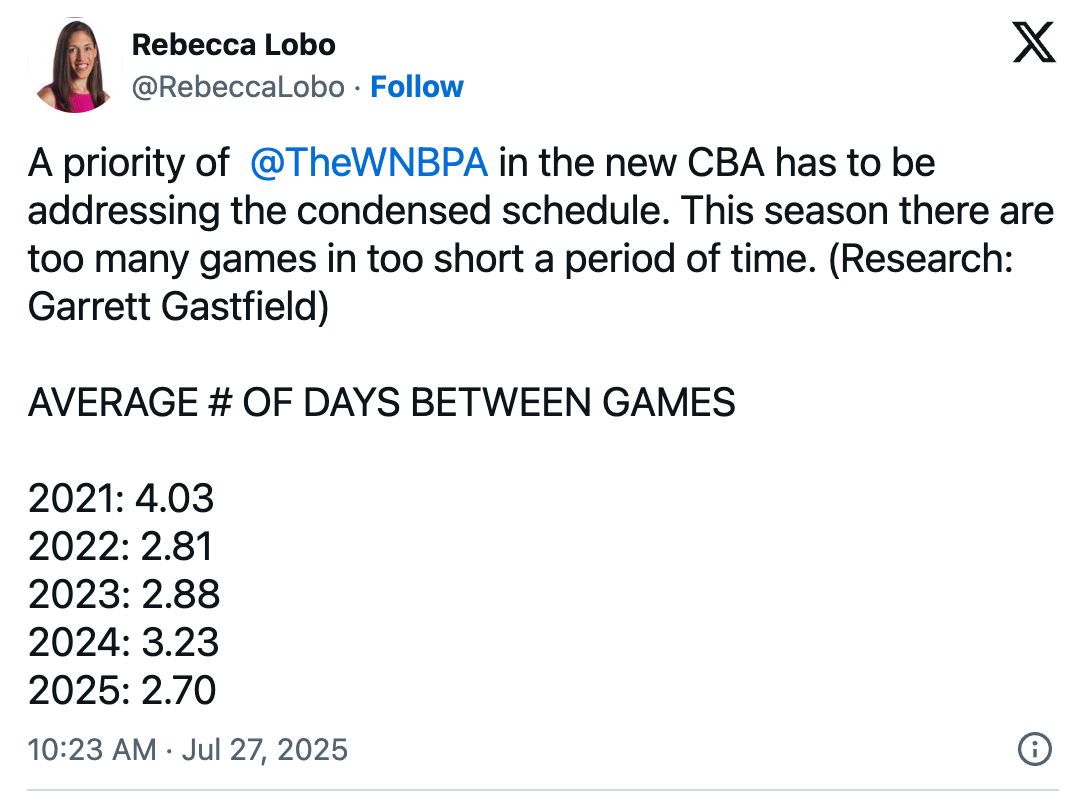
This year’s schedule was just weird at times. It seemed like every game I tuned into, the announcers brought up the strange stretch one of the teams was in the midst of, often with the coach’s platitude “We can’t use that as an excuse. All the teams have to deal with something similar at one point or another”.
The first oddity was teams facing off against one another multiple times in a very short window. The Lynx and Liberty played all four of their matchups within a twoish-week stretch from the end of July to mid-August. When these two teams, last year’s finalists, each started off with nine-game winning streaks, it was disappointing knowing we would have to wait nearly three months to see them face one another. It was even more disappointing when that day finally came and NY was plagued by the aforementioned injuries: we still haven’t gotten to see Stewie face off against Phee this season.
The height of the bottom bar in the chart below represents the number of “rematches” a team had (i.e., facing the same opponent in back to back games) while the height of both bars together represents the number of times a team faced the same opponent at lest twice within a four game window.
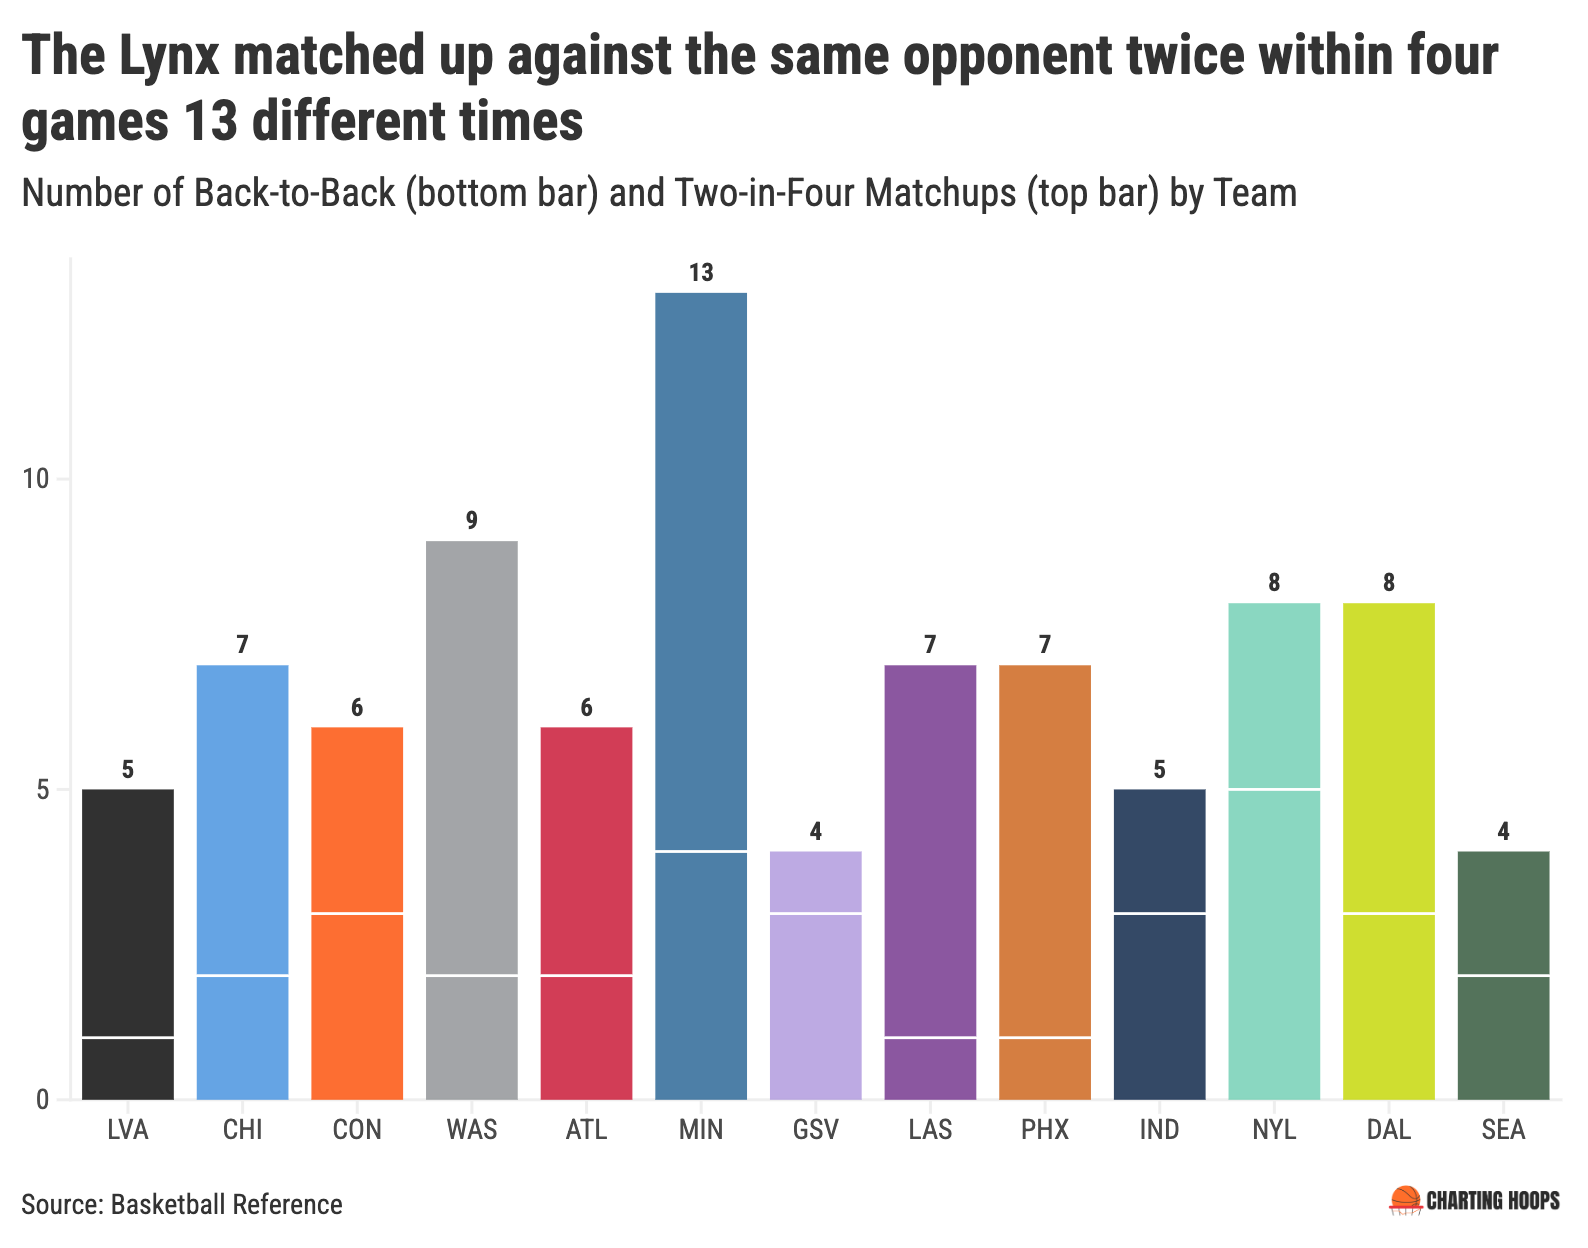
The Lynx had the weirdest schedule in this regard. 13 of their 44 games were against opponents they had just recently played. The series matchup against the Sky was even more condensed than the one against the Liberty: all four MIN-CHI matchups came within seven Lynx games.
The other weird part of the schedule was overly long stretches between games. The Aces just had an eight day break between games, finally coming back to beat the Lynx, who had played three while the Aces rested.
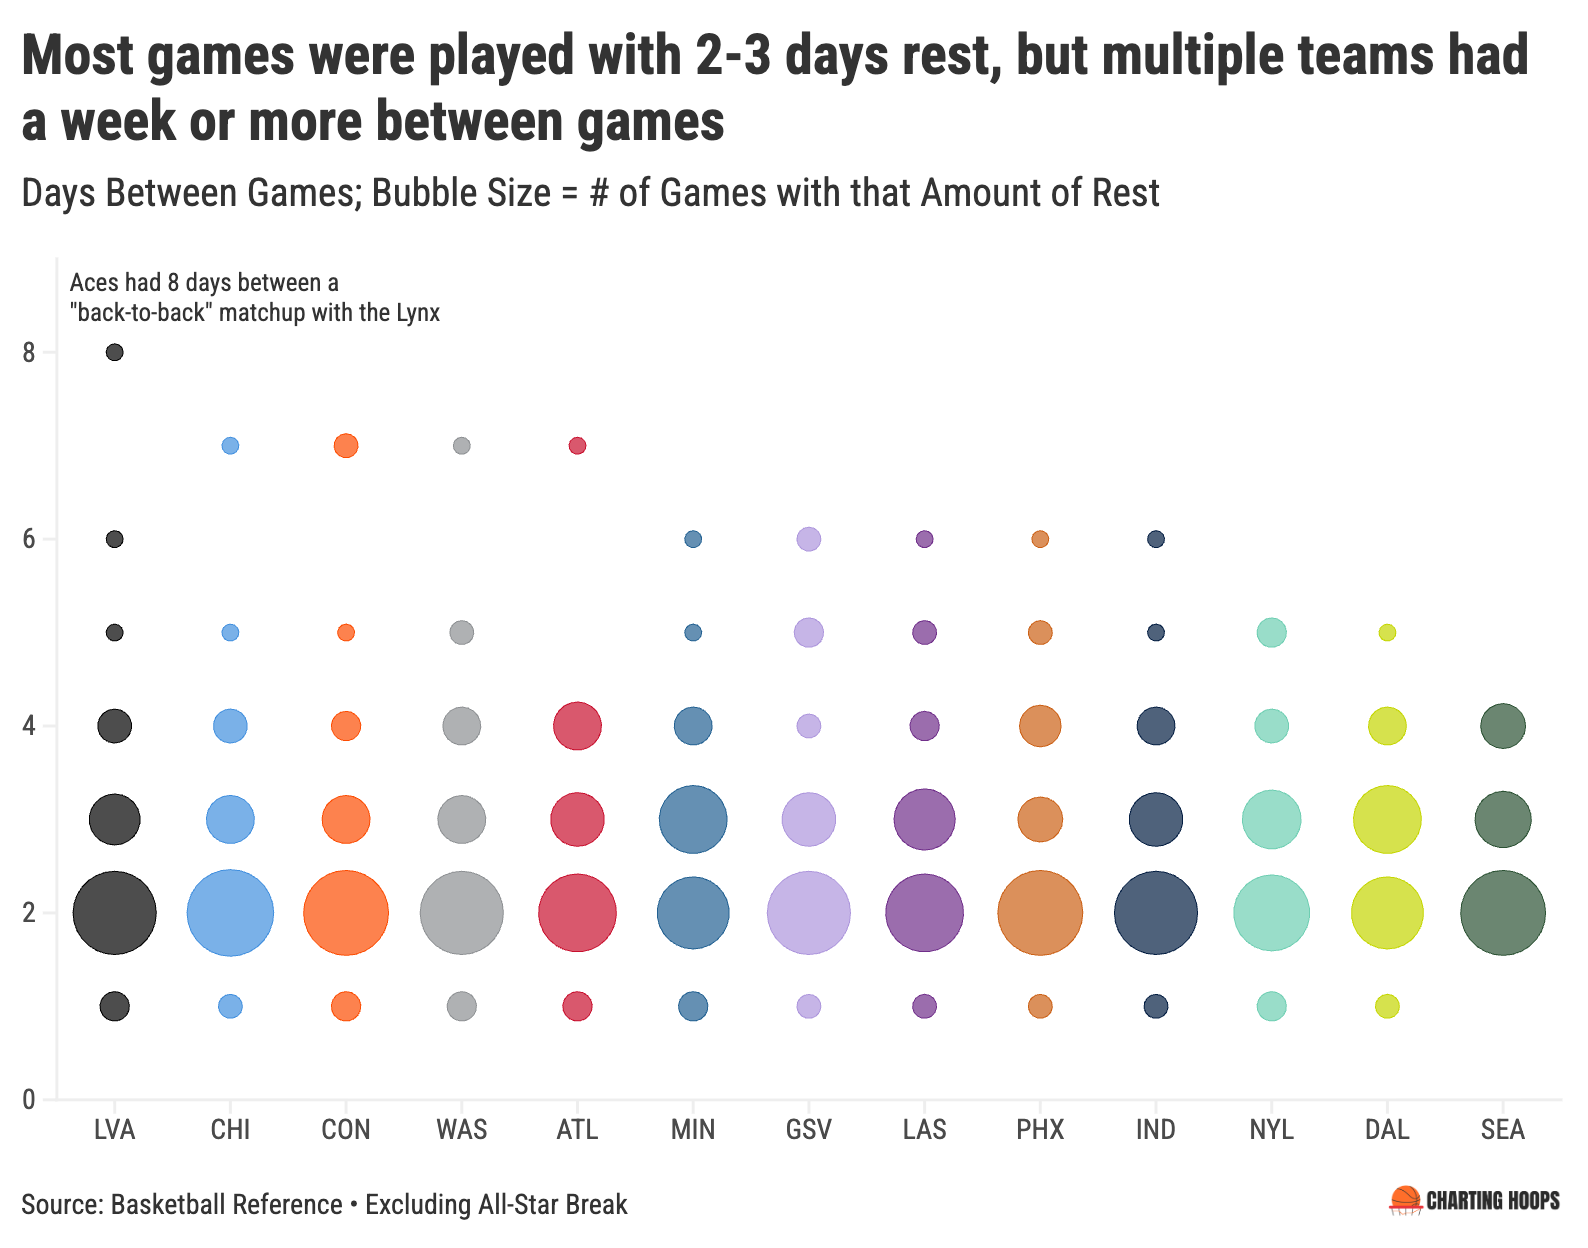
In total, five teams had at least a week break in the middle of the regular season, not counting All-Star. Those long breaks mean the other ones have to be even tighter to fit in all the games.
I understand there are a lot of factors that go into setting the schedule - TV rights, arena conflicts, travel considerations, etc. etc. - but I find it hard to believe this was the optimal way to organize 2025.
Minnesota’s Dominance
Despite their challenging schedule, Minnesota has been dominant all season long. They started 9-0 and by game 15 had the best net rating1 in the W, a position they have not let go of since.2 This team has legitimate candidates for Coach of the Year (Cheryl Reeve), Defensive Player of the Year (Alanna Smith), Sixth Player of the Year (Natisha Hiedeman), and of course, MVP (M-V-Phee).
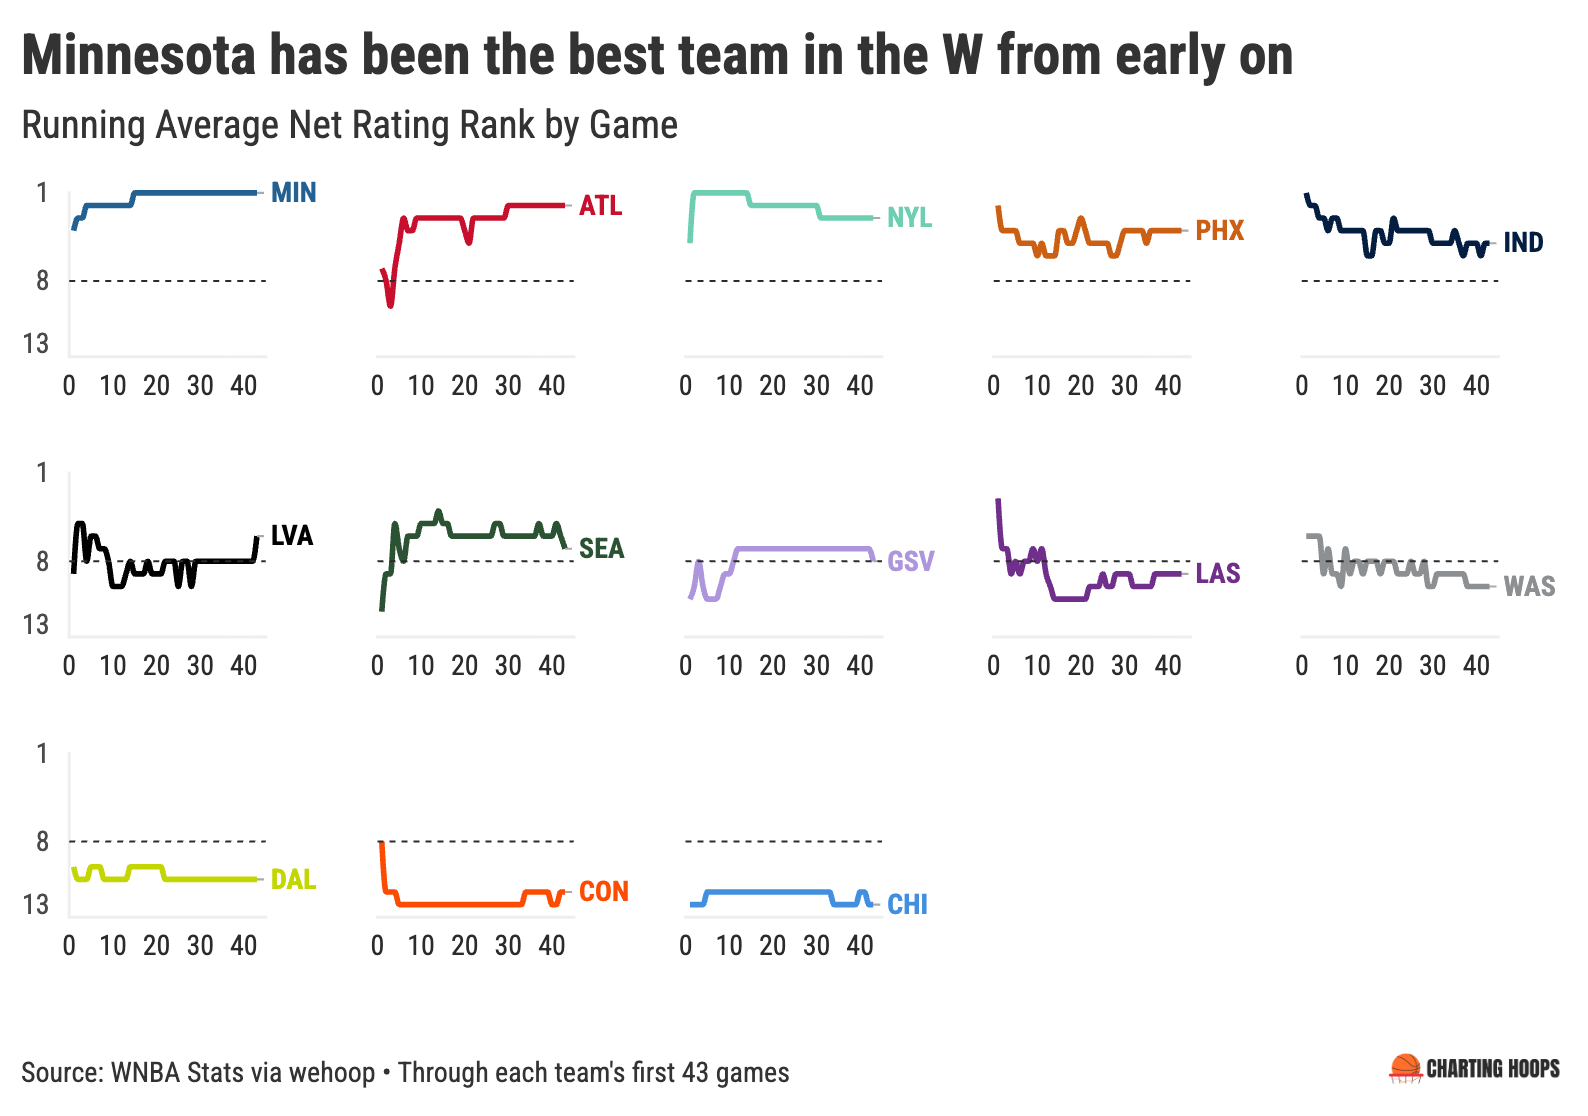
After their own 9-0 start, the Liberty have fallen off hard (see: injuries), winning just half of their games since, but they were beating teams by so much early on that they are still third in net rating.
The Aces have had the opposite season, winning just half of their first 28 games before going on a 14-game win streak. Interestingly, they are still basically an average team by net rating. They were blown out in several of their losses (capped off by the 53-point drubbing at the hands of the Lynx), while 8 of their last 14 wins have been by eight or fewer points.
The Valkyries, yes the expansion Valkyries, were ahead of the Aces in net rating until yesterday. After a slow start (2-5 win-loss record with 17- and 28-point losses in their first handful of games), the Valkyries have been rising, finally securing a playoff spot in their first ever WNBA season.
The Rise of the Valkyries
The upstart Valkyries have been one of, if not the best story in the WNBA sports. This group of castaways, most of whom hadn’t been given a real shot by other teams, was projected to win just 16 games and finish last in the league. Instead, they banded together under Coach of the Year frontrunner Natalie Nakase, and effort’ed their way to 23 wins and a spot in the playoffs, the first WNBA expansion team to make the postseason.
This just does not happen in US professional sports. Across the WNBA, NBA, MLB, and NFL, I counted 39 expansion teams since 1960. The Valkyries are just the second with a winning record,3 and the first, the 1998 Shock, started in year two of the WNBA, when every team was basically brand new.
The Valkyries actually have a losing record on the road, but they have created the best home court advantage in the WNBA. The Golden State Warriors play at Chase Center, but when the Valkyries are in town, the stands fill with purple and it becomes “Ballhalla”. GSV has the highest attendance in the league (every game was a sellout), and the roaring crowd seems to have an impact on outcomes. The Valkyries conceded the lowest opponent three point percentage in the league, and it drops even lower, to under 30% when they are at home.
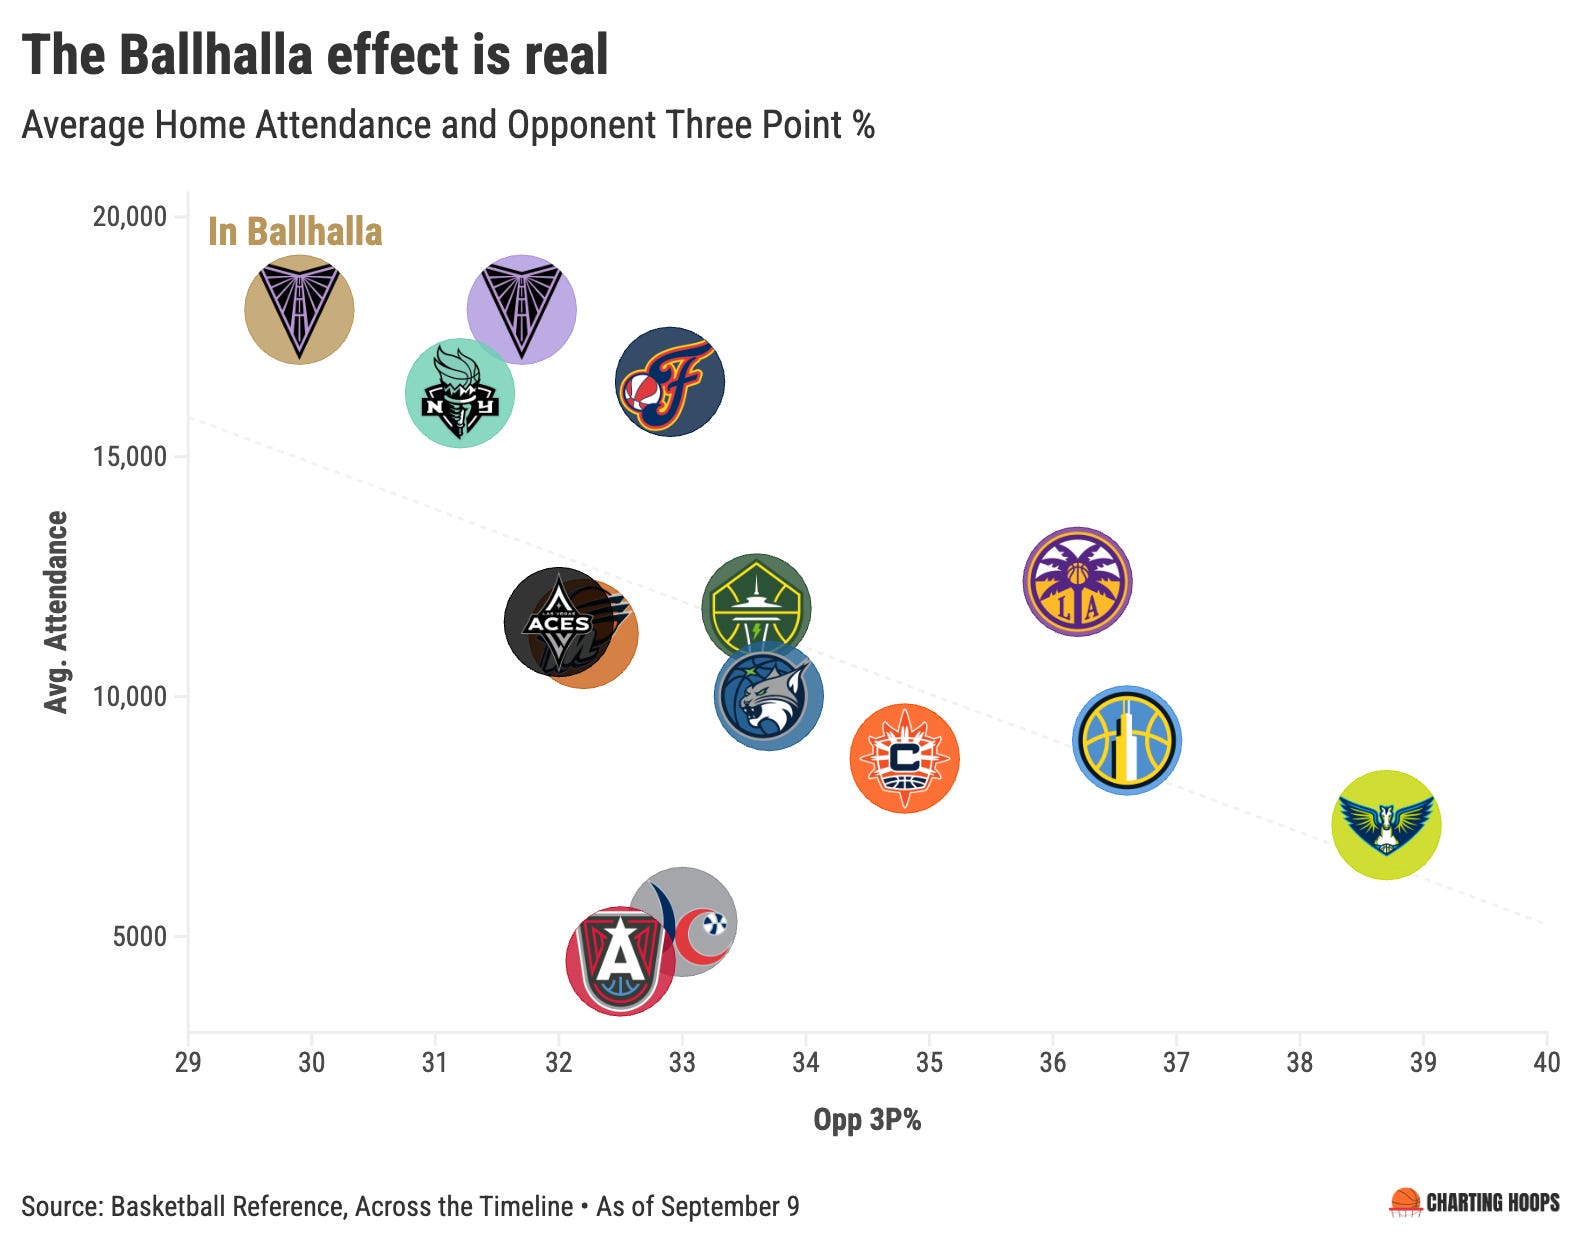
Extremely disappointingly however, the Valkyries will need to transport Ballhalla 45 minutes south, to San Jose’s SAP Center, for their first playoff game. Chase Center was booked by a tennis tournament years ago, before the Valkyries existed, let alone shocked everyone to make the postseason.
The French Connection
Apart from the fan atmosphere, the other major part of the Valkyries success has come from giving European diamonds in the rough a chance to shine. Five Valkyries were born overseas, including three French nationals all in their first or second year in the W: Janelle Salaün, Iliana Rupert, and Carla Leite.
They represent a broader trend of France taking over the WNBA. In addition to the Valks trio, this season has brought in Leïla Lacan in Connecticut, Monique Akoa-Makani in Phoenix, and Dominique Malonga in Seattle,4 while Marine Johannes has returned from a year off and is doing her thing in New York. There was a single French player in the WNBA last season; this year there were nine, who combined for over 2,000 points, passing Australia and setting a new record for international bucket-getters.
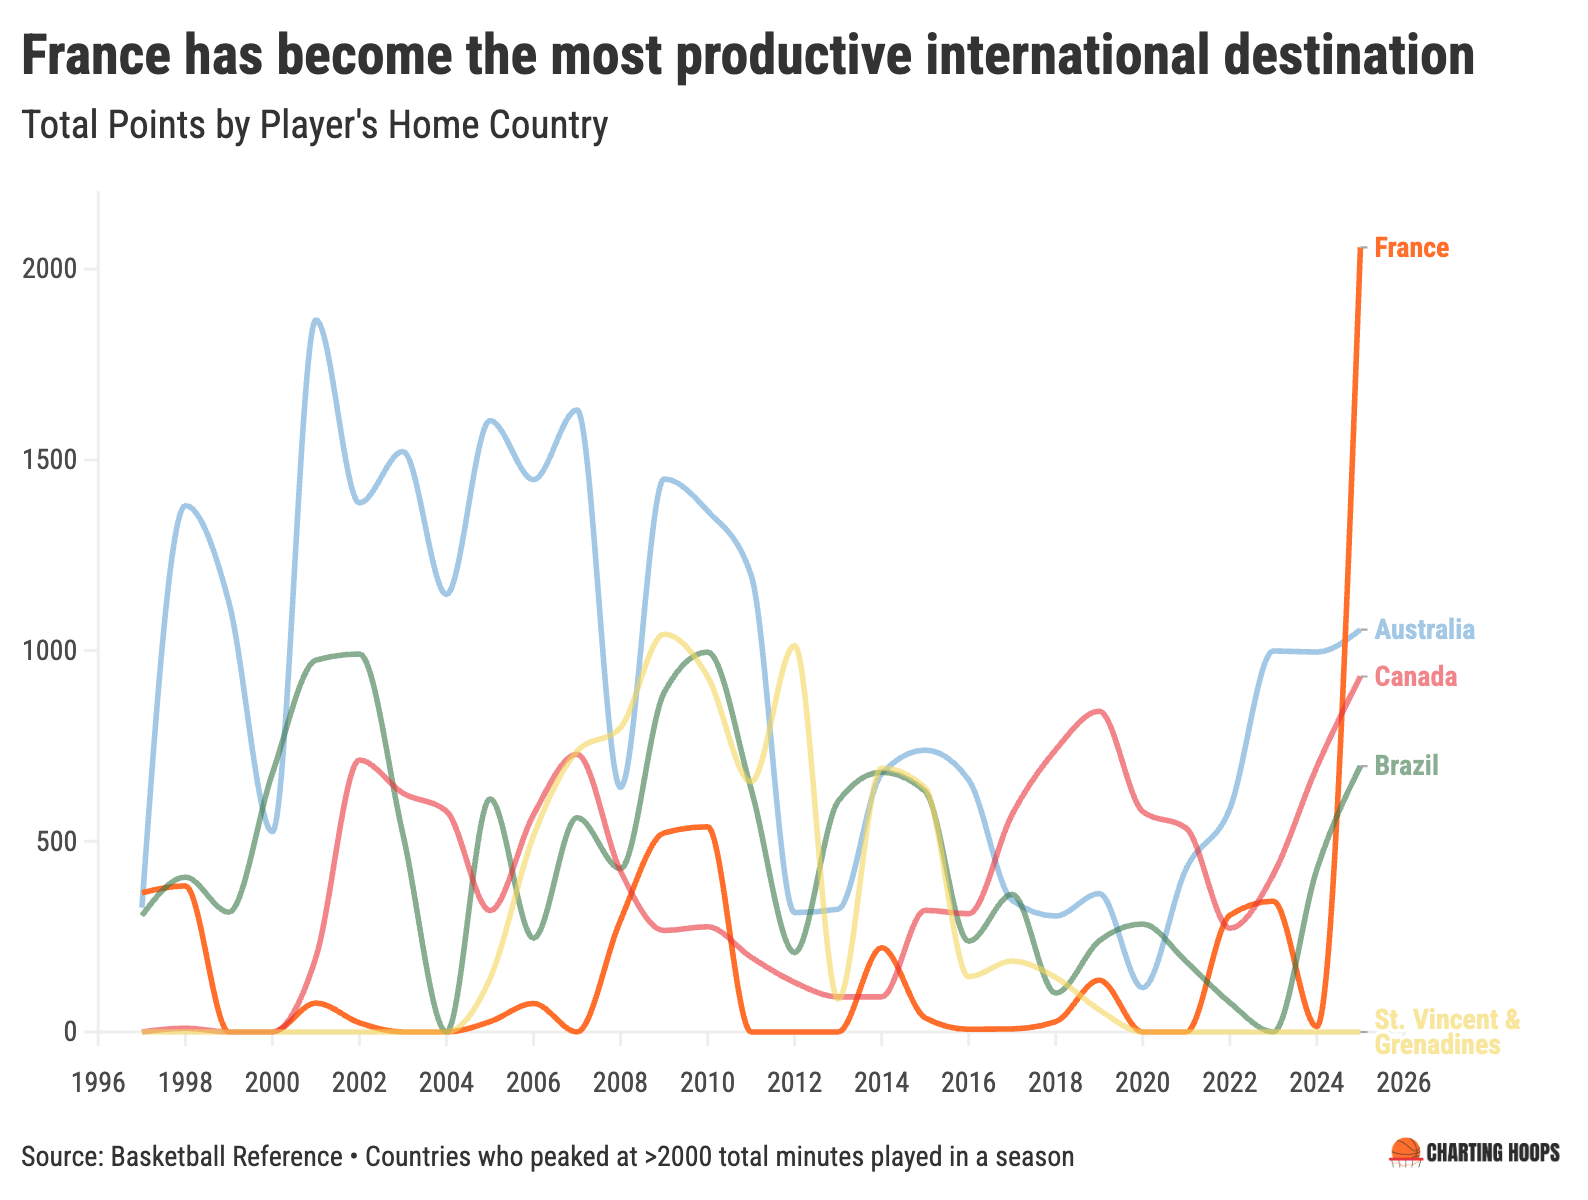
* Heavy caveat that the WNBA is playing 12 more games than in Australia’s peak 2001 season, so on a points per game basis Lauren Jackson, Sandy Brondello, Penny Taylor and their Aussie mates still have the record.
Bueckers Buckets
The French rookies have been super,5 but none of them will win Rookie of the Year. That honor was a bit of a debate between Sonia Citron and Paige Bueckers, until Bueckers dropped a rookie-record 44 points and wrapped up the award for herself.
One of the most common adjectives used to describe Paige is “efficient”. She is efficient with her shot in the midrange, and the stats bear it out. Here are her splits versus the next three picks in last year’s draft on some key efficiency metrics: usage rate (Usage), points per 100 possessions (PP100), and effective field goal percent (eFG%).
Bueckers: Usage 25%; PP100 29; eFG 51%
Malonga: Usage 26%; PP100 28; eFG 56%
Citron: Usage 21%; PP100 24; eFG 56%
Iriafen: Usage 24%; PP100 26; eFG 49%
And here’s where she ranks among some other notable rookies from the WNBA’s past.
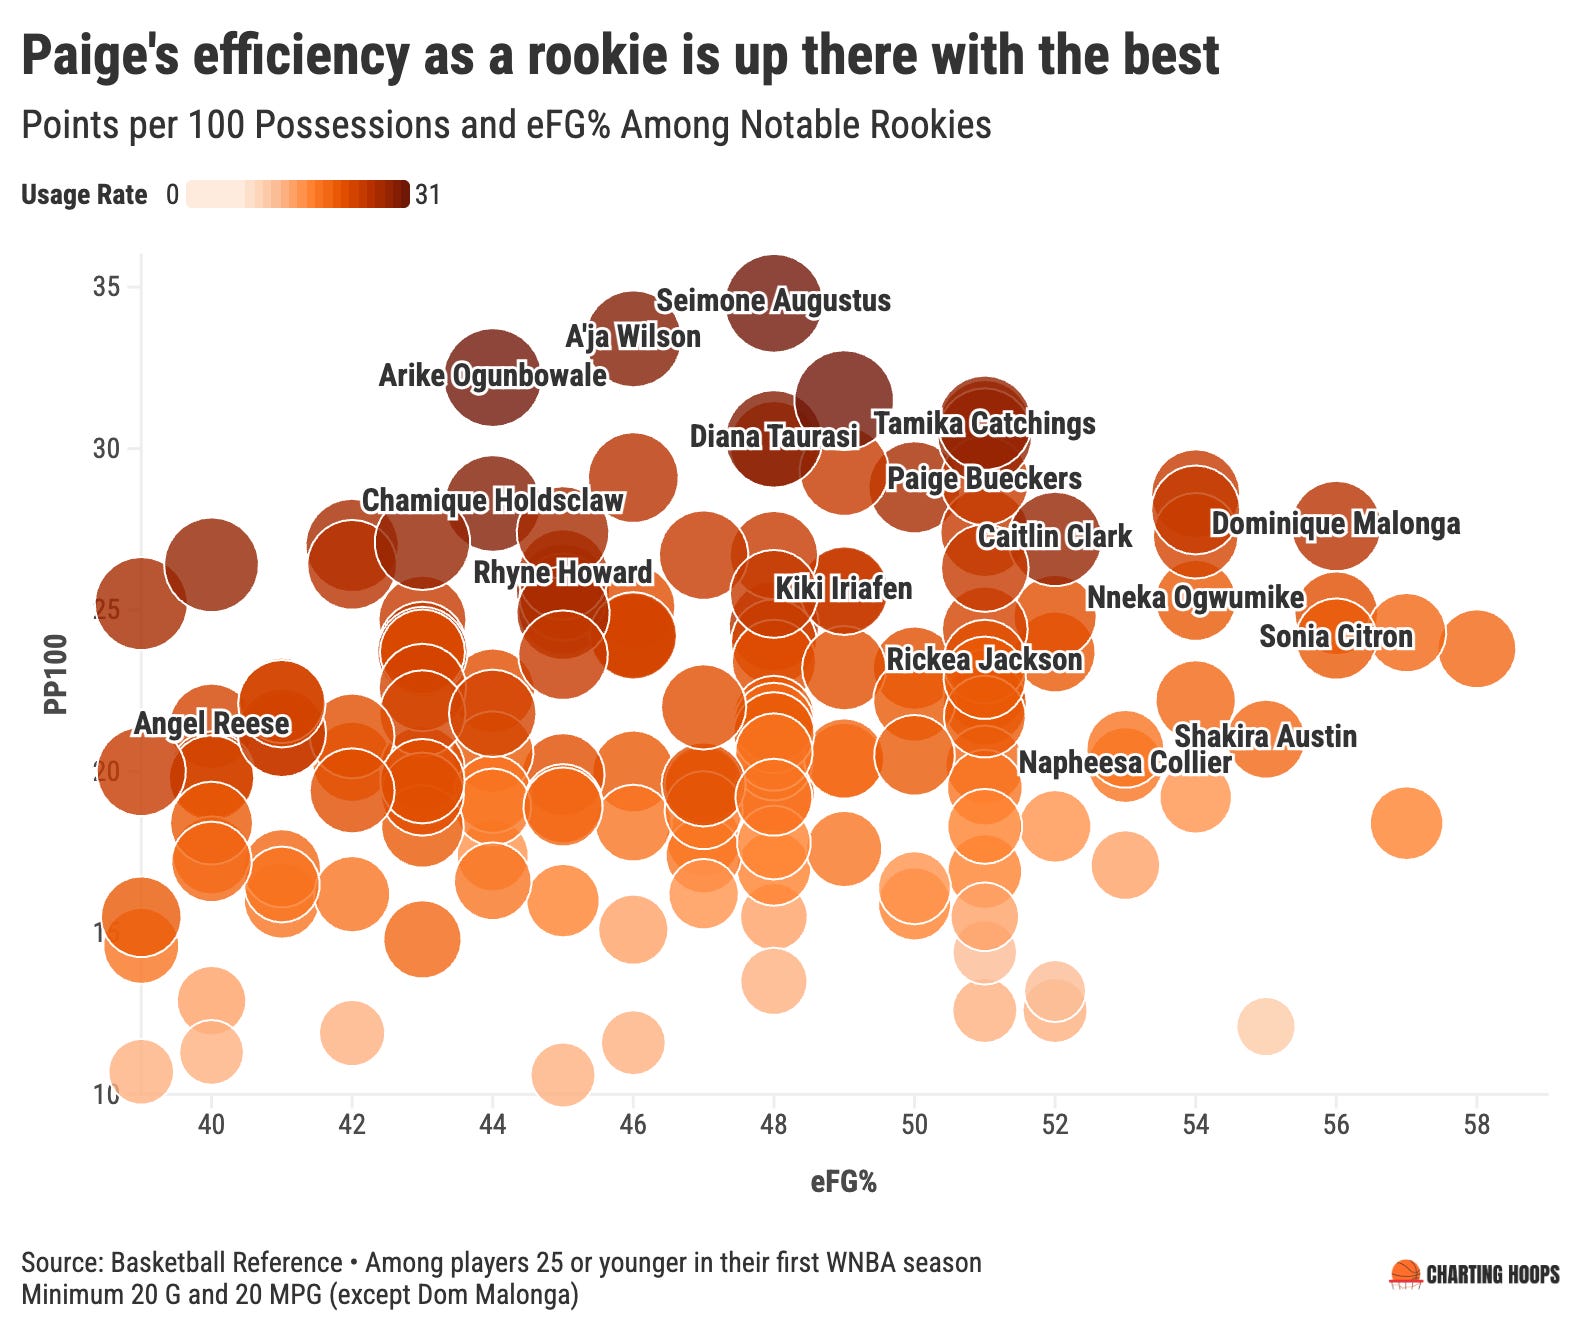
She’s maybe not the most efficient ever, but she is up there with some legendary names.
2025 WNBA regular season wrapped. Grab the popcorn and settle in for the playoffs.
Points you score - points your opponent scores.
Shoutout to Owen Phillips for the inspiration for some of these visuals!
I didn’t include hockey because of ties, but I do acknowledge the Las Vegas Golden Knights and their early success.
Akoa-Makani and Malonga were both born in Cameroon, but moved to France at a young age.
Google Translate tells me “super” is French for “great”, so just read that with a French accent.
Very enjoyable article. I assume the WNBA calendar (and unwillingness to expand duration) is influenced by trying to avoid both the NBA schedule (contention for arena and audience I guess?) and non-US women’s leagues (offseason contracts)…? It will be interesting to see it renegotiated in the next CBA.