

How To: Animate the Hot Hand
An Intro to Manim

All NBA season I’ve been tracking the best three-point shooters, and posting weekly video updates on my Instagram. I’ve gotten a few questions about how I make these videos, so I thought I’d share the full process.
The backbone is a Python library called Manim. Before I get into the nitty gritty, I have to give huge credit to graphsketball for turning me on to it. He uses Manim to make incredible videos breaking down what happened in the NBA, as well as update ongoing series like kings of the court and killer lineups. We’ve even worked on a couple of videos together looking at trade networks and lineup consistency.
Anyway, Manim. As mentioned it’s a Python video library that comes with a bunch of out-of-the-box visuals, animations, and more. It was written by Grant Sanderson for explaining math concepts1 on his 3Blue1Brown YouTube channel. Before you do anything else, I’d recommend watching this video in which he walks through Manim, starting from a simple example and gradually working up to this in a very easy to follow way.
The math animation crowd has stepped up to support Grant and Manim with this super helpful Manim Community wiki. It’s got additional tutorials, a reference manual full of examples of the types of things you can do with Manim, and importantly the installation instructions, which is where you’ll need to start. I’d also recommend downloading Visual Studio Code to use as your IDE, because it supports a Manim Sideview extension that will allow you to see how changes to your code change the video more quickly than having to download and play it in Quicktime every time.
With the preliminaries out of the way, let’s dive into how I made this.
There are a few different scenes in my hot shots videos, but for now we’ll focus on creating the opening table that shows the weekly leaders in three-point makes. If you’d like me to cover how to recreate other parts of the video, like the ending logo animation or the shot charts let me know in the comments.
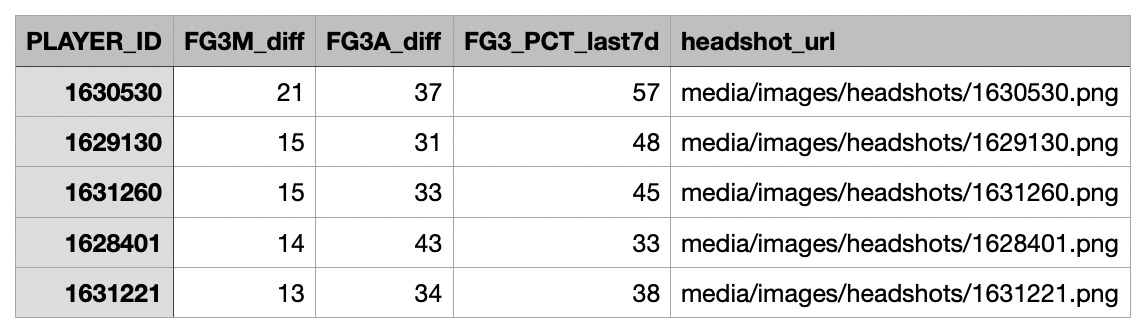
To start, we’ll need the three point stats. Luckily, I already have a post outlining how to pull the data. If you don’t feel like doing a whole other tutorial right now, feel free to fill out a CSV with dummy data; it should look like this:
If you’ve already pulled the hot shots data, all we need to do is filter and format it for Manim. From the weekly_diff data frame we made last time, run this code to get the weekly leaders in three-pointers made.
manim_3P_leaders <- weekly_diff %>%
  select(
    PLAYER_ID,
    FG3M_diff,
    FG3A_diff,
    FG3_PCT_last7d
  ) %>%
  mutate(
    headshot_url = paste0("media/images/headshots/",PLAYER_ID,".png"),
    FG3_PCT_last7d = round(FG3_PCT_last7d)
  ) %>%
  arrange(desc(FG3M_diff), desc(FG3_PCT_last7d)) %>%
  head(5)
write.csv(manim_3P_leaders, file.path(output_dir, "manim_3P_leaders.csv"), row.names = FALSE, quote = TRUE)
cat("Saved to manim_3P_leaders.csv", "\n")
Now we can move into python, and load in the Manim library as well as pandas (for reading in the CSV). At the top of a new .py file write
from manim import *
import pandas as pd
Then we initialize the scene with the following lines.
class NBAHotShots(Scene):
    def construct(self):
Everything will be nested inside this class/function.
Now let’s take a closer look at the table we’ll be making.
The first things to appear are the titles. To create these we simply write:
# Create title
leaders3PM = Text("Weekly Leaders",
                color="#e7343a",
                opacity=1,
                font="Anton",
                font_size = 75,
                )
# Create subtitle
leaders3PM_subtitle = Text("Three Pointers Made",
                color="#f4f0ee",
                opacity=1,
                font="Anton",
                font_size = 35,
                )
Then we position them on the screen. This code says to put the subtitle below (DOWN from) the title, group the title and subtitle together, then move them to the top (UP) of the screen.
leaders3PM_subtitle.next_to(leaders3PM, DOWN)
leaders3PM = VGroup(leaders3PM, leaders3PM_subtitle)
leaders3PM.to_edge(UP)
Animating text is super easy with Manim, using the built in Write effect. The run_time input tells Manim how fast to run this effect. I’ve set it to take 1.5 seconds to finish.
# Write title
self.play(
    Write(leaders3PM),
    run_time=1.5
)
Go ahead and try running your code! This is all you need to create that letter-by-letter fade in effect.
Next, the photos slide in.2 These come from the data table we created in R, so we need to load that in. Do that like you would in any other Python script.
# Load the CSV file with 3PM leaders data
df = pd.read_csv("manim_3P_leaders.csv")
Then extract the headshots like so. The 0.7 tells Manim to make the photos slightly smaller, so they fit better on the phone dimensions.
# Extract images
headshots = [
    ImageMobject(row['headshot_url']).scale(0.7) for _, row in df.iterrows()
]
headshots_group = Group(*headshots)
Then we’ll position the photos.
headshots_group.arrange(DOWN, buff=0.5)
headshots_group.to_edge(LEFT, buff=0.65)
The first line creates the vertical spacing (buffer) between the headshots. The second line moves all the headshots to (almost) the LEFT-most side of the screen. We’ll worry about the animation that shifts them in from the right to left later. The number of threes each player made flies in with their photo, so let’s get those numbers first. From the same CSV we loaded in earlier, we can get the data with this code.
# Extract stats
stats_list = [
    [str(row['FG3M_diff']), str(row['FG3A_diff']), str(row['FG3_PCT_last7d'])]
    for _, row in df.iterrows()
]
We’ll ultimately want to organize these numbers in a table, so let’s go ahead and set that up. First, I wrote a helper function that can create the individual cells in the table for us. It takes in the text you want to write in the cell, the font size, and the height you want it to take up.
# Function to create table cells
def create_cell(text, height, font_size):
    rect = Rectangle(
        width=1.5,
        height=height,
        fill_color="#2b2b2b",
        fill_opacity=0,
        stroke_width=0)
    label = Text(text, font_size=font_size, color="#f4f0ee", font="Anton")
    label.move_to(rect.get_center())
    return VGroup(rect, label)
Then we use it to make the header rows and the data rows and combine them into a table using the VGroup function.
# Create header rows
headers = ["3PM", "3PA", "3P%"]
header_row = VGroup(*[create_cell(h, height = 0.5, font_size = 35) for h in headers]).arrange(buff=0.3)

# Create data rows
data_rows = [
    VGroup(*[create_cell(s, height = headshots[0].get_height(), font_size = 50) for s in stats]).arrange(buff=0.3)
    for stats in stats_list
]

# Combine header and data rows into a table
table = VGroup(header_row, *data_rows)
Then we’ll position this table. If you haven’t noticed, Manim is a lot of creating elements and then precisely placing them on the screen. Thankfully the built in arrange, next_to, and to_edge functions make it easier.
# Create vertical spacing in table
table.arrange(DOWN, buff=0.5)
headshots_group.arrange(DOWN, buff=0.5)

# Position table below title
table.next_to(leaders3PM, DOWN, buff=0.5)
headshots_group.next_to(header_row, DOWN)

# Position headshots to left with slight buffer from edge
headshots_group.to_edge(LEFT, buff=0.65)

# Position table to right of headshots
table.next_to(headshots_group, RIGHT * 0.5)
You’ll notice that when the 3PM numbers fly in, they’re a bigger font, then they “spin” and shrink into their final position in the table. We’ll get to that transformation later, but for now let’s create those “big” numbers.
# Create big, centered 3PM numbers for each row
big_3pm_numbers = VGroup()
for img, stats in zip(headshots, stats_list):
    num = Text(stats[0], font_size=75, color="#f4f0ee", font="Anton")
    num.move_to([0, img.get_center()[1], 0])  # centered horizontally, aligned vertically with headshot
    big_3pm_numbers.add(num)
Ok now we can write the animations. We want the photos and big numbers to start on the right side of the screen then shift to the left. Here’s how we do that. The lag_ratio variable allows us to control the delay between one animation and the next.
# Move headshots and numbers off screen to start
for img, num in zip(headshots, big_3pm_numbers):
    img.shift(RIGHT * 10)
    num.shift(RIGHT * 10)

# Animate headshots and big 3PM (staggered fly-in from right by row)
self.play(
    AnimationGroup(
        *[
            AnimationGroup(
                img.animate.shift(LEFT * 10),
                num.animate.shift(LEFT * 10),
                lag_ratio=0.25  # animate these two together
            )
            for img, num in zip(headshots, big_3pm_numbers)
        ],
        lag_ratio=0.5  # stagger rows
    ),
    run_time=4,
)
It’s all coming together! If this animation isn’t rendering for you, try adding self.wait(2) as a new, last line. Sometimes Manim needs a time buffer to correctly display an animation.
Now for the rest of the table. We’ll treat the first column (which is index 0) a bit differently so we can have that big-to-little spin effect for 3PMs.
# Final 3PM numbers spots in the table
final_3pm_column = VGroup(*[row[0] for row in data_rows])
Then group the remaining columns (3PA, 3P%) as well as the header row, and position them all off the screen to the right.
# Group the remaining columns (3PA, 3P% and header row)
remaining_columns = VGroup()
for i in range(1, len(headers)):
    col = VGroup(*[row[i] for row in data_rows])
    remaining_columns.add(col)
remaining_columns.add(header_row)

for col in remaining_columns:
    col.shift(RIGHT * 8)
Now we can simultaneously spin the three-pointers made column and slide in the rest of the rows using the Transform and shift animations. Notice that the lag_ratio is 0 this time, so that the spin and shift happen at the same time.
# Transform big 3PM numbers into their spots in the table + fade in rest of columns
self.play(
    *[Transform(big, small) for big, small in zip(big_3pm_numbers, final_3pm_column)],
    AnimationGroup(
        *[
            AnimationGroup(
                col.animate.shift(LEFT * 8),
            )
            for col in remaining_columns
        ],
        lag_ratio=0
    ),
    run_time=2,
)
self.wait(2)
We’re almost there! Finally, we can add the “ranking” numbers on the left. Let’s create those and align them with the middle of the headshots.
# Create and position ranking numbers aligned with headshots
x_offset = headshots_group.get_left()[0] + 0.4
ranking_numbers = VGroup()
for img, idx in zip(headshots, range(len(headshots))):
    y_offset = img.get_center()[1] - (img.height * 0.5)  # Adjusted slightly downward
    num = Text(str(idx + 1), font_size=75, color="#f4f0ee", font="Anton")
    num.move_to([x_offset, y_offset, 0])
    ranking_numbers.add(num)

# Ensure ranking numbers and stats rows up with corresponding headshots
for i in range(len(headshots)):
    y_pos = headshots[i].get_center()[1]
    ranking_numbers[i].move_to([ranking_numbers[i].get_center()[0], y_pos, 0])
    data_rows[i].move_to([data_rows[i].get_center()[0], y_pos, 0])
Now we can write the titles and ranking numbers at the same time. Replace the original title writing code from above with this.
# Write title & ranking numbers
self.play(
    Write(leaders3PM),
    Write(ranking_numbers),
    run_time=1.5
)
Then paste the previous two blocks involving the ranking numbers directly below the line table.next_to(headshots_group, RIGHT * 0.5) so that the animations play in the right order.
Voila! You made a Manimation, and visualized the hot hand.
Again, let me know if you’d like me to expand on other parts of this video (e.g., shot chart, logo animation) or dive into how I made my NBA Maps using this same library.
Happy coding.
Manim is a portmanteau for math animation.
I’m ignoring the rank numbers 1-5 on the left on purpose. We’ll return to those.
These tutorials are really great. I've improved a few of my very simple tables using your help!